 |
| 2017 EMCC Student Conference Poster Draft |
Thursday, April 20, 2017
EMCC Student Conference Poster
I was fortunate enough to have been selected to present my research project at the 2017 EMCC Student Conference. Because of this, most of my week consisted of adding, editing and deleting items from my poster. Creating a poster may not seem like fun for others but in this case, I enjoyed making it. In high school, I took a graphic design class (which I loved) and even though this poster did not require much, it definitely reminded me of that class. It reminded me of the way colors work, the spacing between words and how small or big images should be. This was different than the usual “researching and following protocols” day. Now, that’s not to say I don’t like those days but I definitely liked the change in schedule. Below is a draft of the poster (I will upload the final once it has been revised/ approved). Nonetheless, presentations begin on April 26th and I am trying not to freak out!

Thursday, April 13, 2017
Electrophoresis
This week, to determine the quantity of DNA yielded from each extraction method, (QuickExtract DNA extraction kit, boiling, microwave and enzymatic digestion followed by heating) agarose electrophoresis was performed. Through this, I became very confused with the results. Before I get into this, in the first slot, I had inserted a PCR MW Ruler. After that, the following slots from 2-13 were filled with 1 microliter of dye mixed with 5 microliters of DNA from QE1 (QuickExtract protocol), QE2, QE3, M2 (microwave protocol), M3-1, M3-2, M4, B3 (boiling protocol), EDL2 (enzymatic digestion followed by heating using Ready-Lyse Lysozyme), EDL3, EDL4, EDL5 and EDP1 (enzymatic digestion followed by heating using proteinase K) respectively. Using the NanoDrop spectrophotometer (Figures 1 and 2), it is shown that the enzymatic followed by digestion samples had relatively a higher amount of DNA (looking under the column “nucleic acid”). With that said, I was expecting that slots 10 and beyond (which had the enzymatic digestion followed by heating samples) would have bright strands of DNA. The brighter the strands, the more DNA would be present. However, to my surprise, that was not the case. Instead, the microwave method, which had less DNA than mentioned protocol, had brighter strands. As a matter of fact, slots 9-14 appear to have no strands at all (Figure 3). Next week, PCR will be performed on these samples to determine if I have any DNA. In the meantime, I am hoping that the PCR will not cause any further confusion.
 |
| Figure 1. NanoDrop Spectrophotometer nucleic acid report of all samples from different DNA extraction methods. |
 |
| Figure 2. NanoDrop Spectrophotometer nucleic acid report of all samples from different DNA extraction methods. |
 |
| Figur,e 3. Electrophoresis results after sampling PCR MW Ruler, QE1, QE2, QE3, M2, M3-1, M3-2, M4, B3, EDL2, EDL3, EDL4, EDL5 and EDP1 in each slot respectively. |
Thursday, April 6, 2017
Enzymatic Digestion Followed By Heating Protocol Modifications
After looking at the Nucleic Acid Report I collected from the NanoDrop Spectrophotometer last week, I noticed that the best DNA extraction method (compared to the others) so far is the enzymatic digestion followed by heating using Ready-Lyse Lysozyme and proteinase K (Figure 1). When referring to the “best DNA extraction method”, it is the protocol that has a purity close to 1.8 for DNA and close to 2.0 for RNA under the 260/280 column (“260/280 and 260/230 Ratios”, n.d.). Because the values for the enzymatic digestion followed by heating using Ready-Lyse Lysozyme and proteinase K are somewhat close to these values (closer than the other protocols, excluding the commercial kit), during this week, I worked specifically with these two protocols. However, the past week, in tubes EDL1, EDL2 and EDL3, I added 1 microliter of Ready-Lyse Lysozyme and in tubes EDP1, EDP2 and EDP3, I added 2 microliters of proteinase K. This week, in tubes EDL 4 and EDL 5, I added 2 microliters and 3 microliters of Ready-Lyse Lysozyme respectively. Using proteinase K, in tubes EDP 4 and EDP 5, I added 3 microliters and 4 microliters of proteinase K respectively. The results of the purity (260/280 column) of DNA in each tube are shown below in Figure 2. With these results, the increase in Ready-Lyse Lysozyme seems to decrease the purity of DNA and RNA and decrease the number of nucleic acid. However, an increase in proteinase K seems to have very little effect on the amount of nucleic acid and purity of DNA and RNA, increasing slightly in both areas.
Works Cited:
260/280 and 260/230 Ratios [PDF]. (n.d.). Wilmington: Thermo Scientific. |
| Figure 1. Eppendorf tubes EDL1, EDL2, EDL3, EDP1, EDP2 & EDP3 used in the enzymatic digestion followed by heating protocol using Ready-Lyse Lysozyme and proteinase K. |
 |
| Figure 2. Eppendorf tubes EDL4, EDL5, EDP4 & EDP5 used in the enzymatic digestion followed by heating protocol using proteinase K. |

Thursday, March 30, 2017
NanoDrop Spectrophotometer Nucleic Acid Report
During this week, I focused primarily on the enzymatic digestion followed by heating protocol. Specifically, since this protocol has three different ways to perform it (using Ready-Lyse Lysozyme, proteinase-K, 10% Tween 20 and 20% SDS), I did not use Ready-Lyse Lysozyme and worked with the remaining substances. I was able to perform three sets of Eppendorf test tubes that used proteinase-K and another three that used proteinase-K plus 10% Tween 20 and 20% SDS. After I was done with the protocols, I ran them under the NanoDrop Spectrophotometer and the results are shown below. Not only does the graph show the values for these six test tubes but it shows the results of all of the protocols I have performed so far (boiling, QuickExtract commercial kit and microwave).
 |
| NanoDrop Spectrophotometer nucleic acid report of the boiling protocol, QuickExtract commercial kit, microwave protocol and enzymatic digestion followed by heating protocol. |
Thursday, March 23, 2017
Enterococcus faecalis
Enterococcus faecalis is a gram-positive opportunistic pathogen that generally causes urinary tract infections, wound infections and a variety of nosocomial (originate in a hospital) infections. To better see this bacteria, the first image shown below shows a Scanning Electron Micrograph (SEM) of it. Through fecal contamination, this bacteria is commonly found in food, sewage, water and soil (Paulsen, 2003). In other words, it can be found in a variety of materials we come into contact everyday. In addition, E. faecalis is able to withstand “oxidative stress, desiccation, and extremes of temperature and pH, and it has high endogenous resistance to salinity, bile acids, detergents, and antimicrobials” (Paulsen, 2003). Because of this, it has acquired “intrinsic resistance to many antibiotics and a remarkable capacity for developing resistance to others” and “now ranks among the most troublesome hospital pathogens” (Phillips, 1995). For example, E. faecalis has become resistant to vancomycin. The bacteria's genome carries its ability for resistance, which is shown below in the second image. As a result of its resistance, this bacteria “persist[s] in the hospital environment and survive[s] many host defenses” (McBride, 2007). Not only has it become resistant to various antibiotics and antimicrobial agents but it produces a two-subunit toxin, also known as cytolysin; this toxin is active against eukaryotic and prokaryotic cells. With the production of cytolysin, this bacteria is able “to actively probe the environment for target cells, and when target cells are detected, allows the organism to express high levels of cytolysin in response” (Coburn, 2004). However, this toxin is not the only material produced by E. faecalis, it also creates a “gelatinase, enterococcal surface protein Esp, aggregation substance, a hyaluronidase, and a bile salt hydrolase”, which are “known or suspected of enhancing the virulence” of this bacteria. (McBride, 2007).
Unfortunately, due to how complex this bacteria is, knowledge as to how it causes diseases and “transfer[s] antibiotic resistance to other pathogens” is limited (Nallapareddy, 2005). Therefore, because of its complexity, expanding knowledge on Enterococcus faecalis is evidently necessary and critical. In other words, being able to “characterize the genetic background of a [E. faecalis] strain makes possible the study of the flow of mobile elements within the species” (McBride, 2007). Being able to successfully accomplish this will “define the diversity of the E. faecalis species and to determine the core genome content” (McBride, 2007). With this, pharmaceutical scientists will be able to develop or improve drugs currently used on this bacteria and, thus, allow affected individuals to recover quickly and more efficiently.
Through DNA extractions of Enterococcus faecalis, identifying it, diagnosing infections and progressing in drugs will easily be achieved. Hence, in an attempt to quickly, successfully and effectively identify E. faecalis, four different DNA extraction protocols will be performed. These methods will determine which one is successful in yielding the most amount of DNA. The DNA extraction protocols are as follows: QuickExtract Bacterial DNA Extraction Kit, boiling method, microwave method and enzymatic digestion followed by heating method. These four procedures will be compared to a commercially produced kit. It is hypothesized that the boiling method will yield the most amount of DNA in Enterococcus faecalis. Following the boiling method, it is expected that the procedure to produce the second highest amount of DNA in E. faecalis will be the enzymatic digestion followed by heating. Lastly, the microwave method is expected to yield the least amount of DNA of this bacteria. In order to determine the quantity of DNA yielded from each extraction protocol, nanodrop spectrophotometry and electrophoresis will be performed.
Sources
Ahmed, O., Asghar, A., & Elhassan, M. (2014). African Journal of Microbiology Research. Comparison of three DNA extraction methods for polymerase chain reaction (PCR) analysis of bacterial genomic DNA. Retrieved February 23, 2017, from http://www.academicjournals.org/article/article1391446214_Ahmed%20et%20al.pdf
Coburn, P. S. (2004). Biography in Context. Enterococcus faecalis senses target cells and in response expresses cytolysin, 306. Retrieved March 23, 2017.
Dashti, A., Jadaon, M., Abdulsamad, A., & Dashti, H. (2009). Heat Treatment of Bacteria: A Simple Method of DNA Extraction for Molecular Techniques. Kuwait Medical Journal. Retrieved from https://www.researchgate.net/publication/266888615_Heat_Treatment_of_Bacteria_A_Simple_Method_of_DNA_Extraction_for_Molecular_Techniques
Englen, M., & Kelley, L. (2000). Letters in Applied Microbiology . A rapid DNA isolation procedure for the identification of Campylobacter jejuni by the polymerase chain reaction. Retrieved February 23, 2017, from http://onlinelibrary.wiley.com/store/10.1046/j.1365-2672.2000.00841.x/asset/j.1365-2672.2000.00841.x.pdf?v=1&t=izj0lngs&s=ffc6e6e746158600322301279b959afb27079119
Epicentre. (2012). QuickExtract™ Bacterial DNA Extraction Kit. Retrieved February 28, 2017, from http://www.epibio.com/docs/default-source/protocols/quickextract-bacterial-dna-extraction-kit.pdf?sfvrsn=8
McBride, S., Fischetti, V., LeBlanc, D., Moellering, R., & Gilmore, M. (2007). PLOS One. Genetic Diversity among Enterococcus faecalis. doi:10.1371/journal.pone.0000582
Nallapareddy, S., Wenxiang, H., Weinstock, G. M., & Murray, B. E. (2005). Journal of Bacteriology. Molecular Characterization of a Widespread, Pathogenic, and Antibiotic Resistance-Receptive Enterococcus faecalis Lineage and Dissemination of Its Putative Pathogenicity Island. Retrieved March 23, 2017.
Oliveira, C. F., Paim, T. G., Reiter, K. C., Rieger, A., & D'azevedo, P. A. (2014, Jan. & feb.). Evaluation of four different DNA extraction methods in coagulase-negative staphylococci clinical isolates. Retrieved February 23, 2017, from https://www.ncbi.nlm.nih.gov/pmc/articles/PMC4085835/
Paulsen, T., Banerjei, L., & Myers, G. S. (2003). Science. Role of Mobile DNA in the Evolution of Vancomycin-Resistant Enterococcus faecalis. doi:10.1126/science.1080613
Phillips, D. M., Ph.D. (1995). Images in Clinical Medicine (K. Eagle M.D., Ed.). Enterococcus faecalis. doi:10.1056/NEJM199501053320105
 |
| Scanning Electron Micrograph (SEM) of Enterococcus faecalis. (Phillips, 1995). |
 |
| Enterococcus faecalis genome (Paulsen, 2003). |
Thursday, March 9, 2017
NanoDrop Spectrophotometer & EMCC Research Abstract
During my fourth week, I did not continue to test any of my DNA extraction methods. However, with the methods (QuickExtract, boiling and enzymatic digestion followed by heating using Ready-Lyse Lysozyme) that I performed last week, I was able to figure out how much DNA was extracted from Enterococcus faecalis using a NanoDrop spectrophotometer (image shown below). Even though I do not know how to read the graphs and they all look different, I hope I correctly performed them. As mentioned earlier, I was not in the lab throughout the week. Instead, I was busy writing and editing my Estrella Mountain Community College (EMCC) research abstract for the student conference. I am looking forward towards presenting my project, even though I am a little nervous.
 |
| NanoDrop Spectrophotometer |
Thursday, March 2, 2017
DNA Extraction Methods on Enterococcus Faecalis (Week 3)
During my 3rd week, I began working on my research project, which involved 4 DNA extraction methods following a set of protocols. I am trying to determine which DNA extraction method will yield the most of amount of DNA from Enterococcus faecalis. The methods that I am testing include a commercial kit and 3 (one includes 3 different chemicals to use) methods that I chose. The name of the commercial kit is QuickExtract. For this method, I followed a protocol and used QuickExtract Bacterial DNA and Ready-Lyse Lysozyme (1st image shown below). Since it is a commercial kit, it is supposed to yield the most amount of DNA. As for the other 3 methods, I will use protocols for a boiling, microwave and enzymatic digestion followed by heating (done using 3 different chemicals) method. The boiling method did not require any chemicals so I only needed my bacteria, a centrifuge and a water bath. For the microwave method, I will need a centrifuge, TE buffer (2nd image shown below), 15% SDS, a microwave, lysis buffer and ethanol. As for the enzymatic digestion followed by heating method, a centrifuge is needed along with 3 different chemicals (only that each time I perform the protocol, only one chemical is used). The 3 different chemicals that I will use are Ready-Lyse Lysozyme, proteinase K, 10% Tween 20, and 15% SDS (proteinase K, 10% Tween 20, and 15% SDS will be used altogether in during one protocol). However, during this week, I was only able to perform 3 methods: QuickExtract, boiling and one of the ways to perform enzymatic digestion followed by heating (I used Ready-Lyse Lysozyme). Next week, I will be working on the microwave method and using the remaining chemicals for the enzymatic digestion followed by heating method.
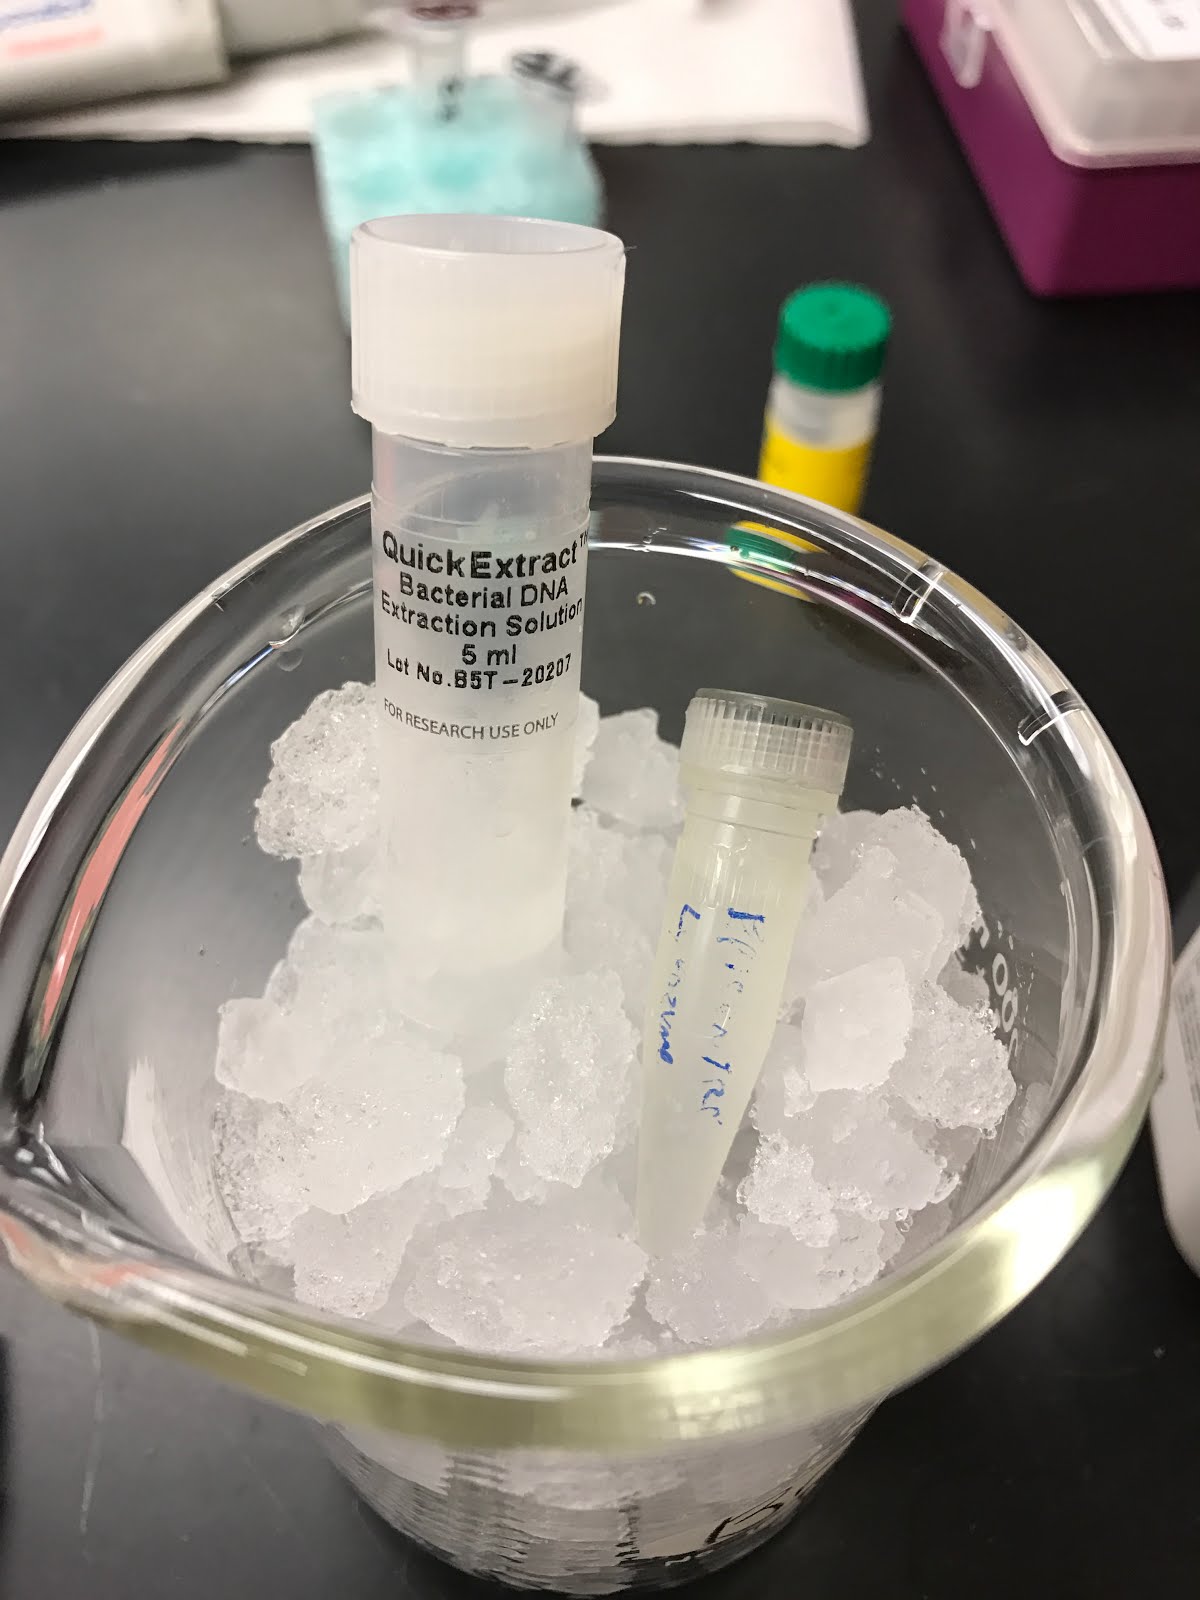 |
| QuickExtract Bacterial DNA & Ready-Lyse Lysozyme |
 |
| TE buffer |
Subscribe to:
Posts (Atom)