 |
| Figure 1. Possible PowerPoint theme for the research project that was carried during the Fall 2017 S-STEM internship. It will be titled "Identification of Bacteria Isolated From Wild and Urban Larrea Tridentata Utilizing RS-16 Sequencing". |
Thursday, November 30, 2017
Missing Bacterial DNA
Unfortunately, I found out about two weeks ago that the DNA I had extracted from my unknown bacteria was missing. I know I had not misplaced it or threw it away because I remember putting it back where it always goes. I had not mentioned it before because I thought that it would eventually turn up. However, that was not the case and I am quite upset about it because I am almost certain that it was not a mistake I made. With that said, there was no further advancement in my research project this week. Instead, I was preparing and creating a PowerPoint about my research, along with adding more information to my final paper. As far as I am concerned, I will present this PowerPoint in front of other STEM interns and Bioscience faculty. I guess I am going to have to find out for myself in a couple of weeks!

Thursday, November 16, 2017
Additional Unknown Bacteria
From last week’s broth, the resulting broth that was left at room temperature over the weekend is seen in Figure 1. In addition, this week, I grew Samantha Faltermeier’s unknown bacteria in TSB broth. The bacteria that I am working with has been isolated on a TSA plate from a creosote bush. As a side note, this bacteria is quite interesting because they all seem to be different. For instance, some have a horrible stench, while others don’t. Also, some almost look like snowflakes and some look like a typical round bacterial colony. As mentioned last week, I performed DNA extraction on these unknowns. Next week, if I am able to, PCR and electrophoresis are the next steps!
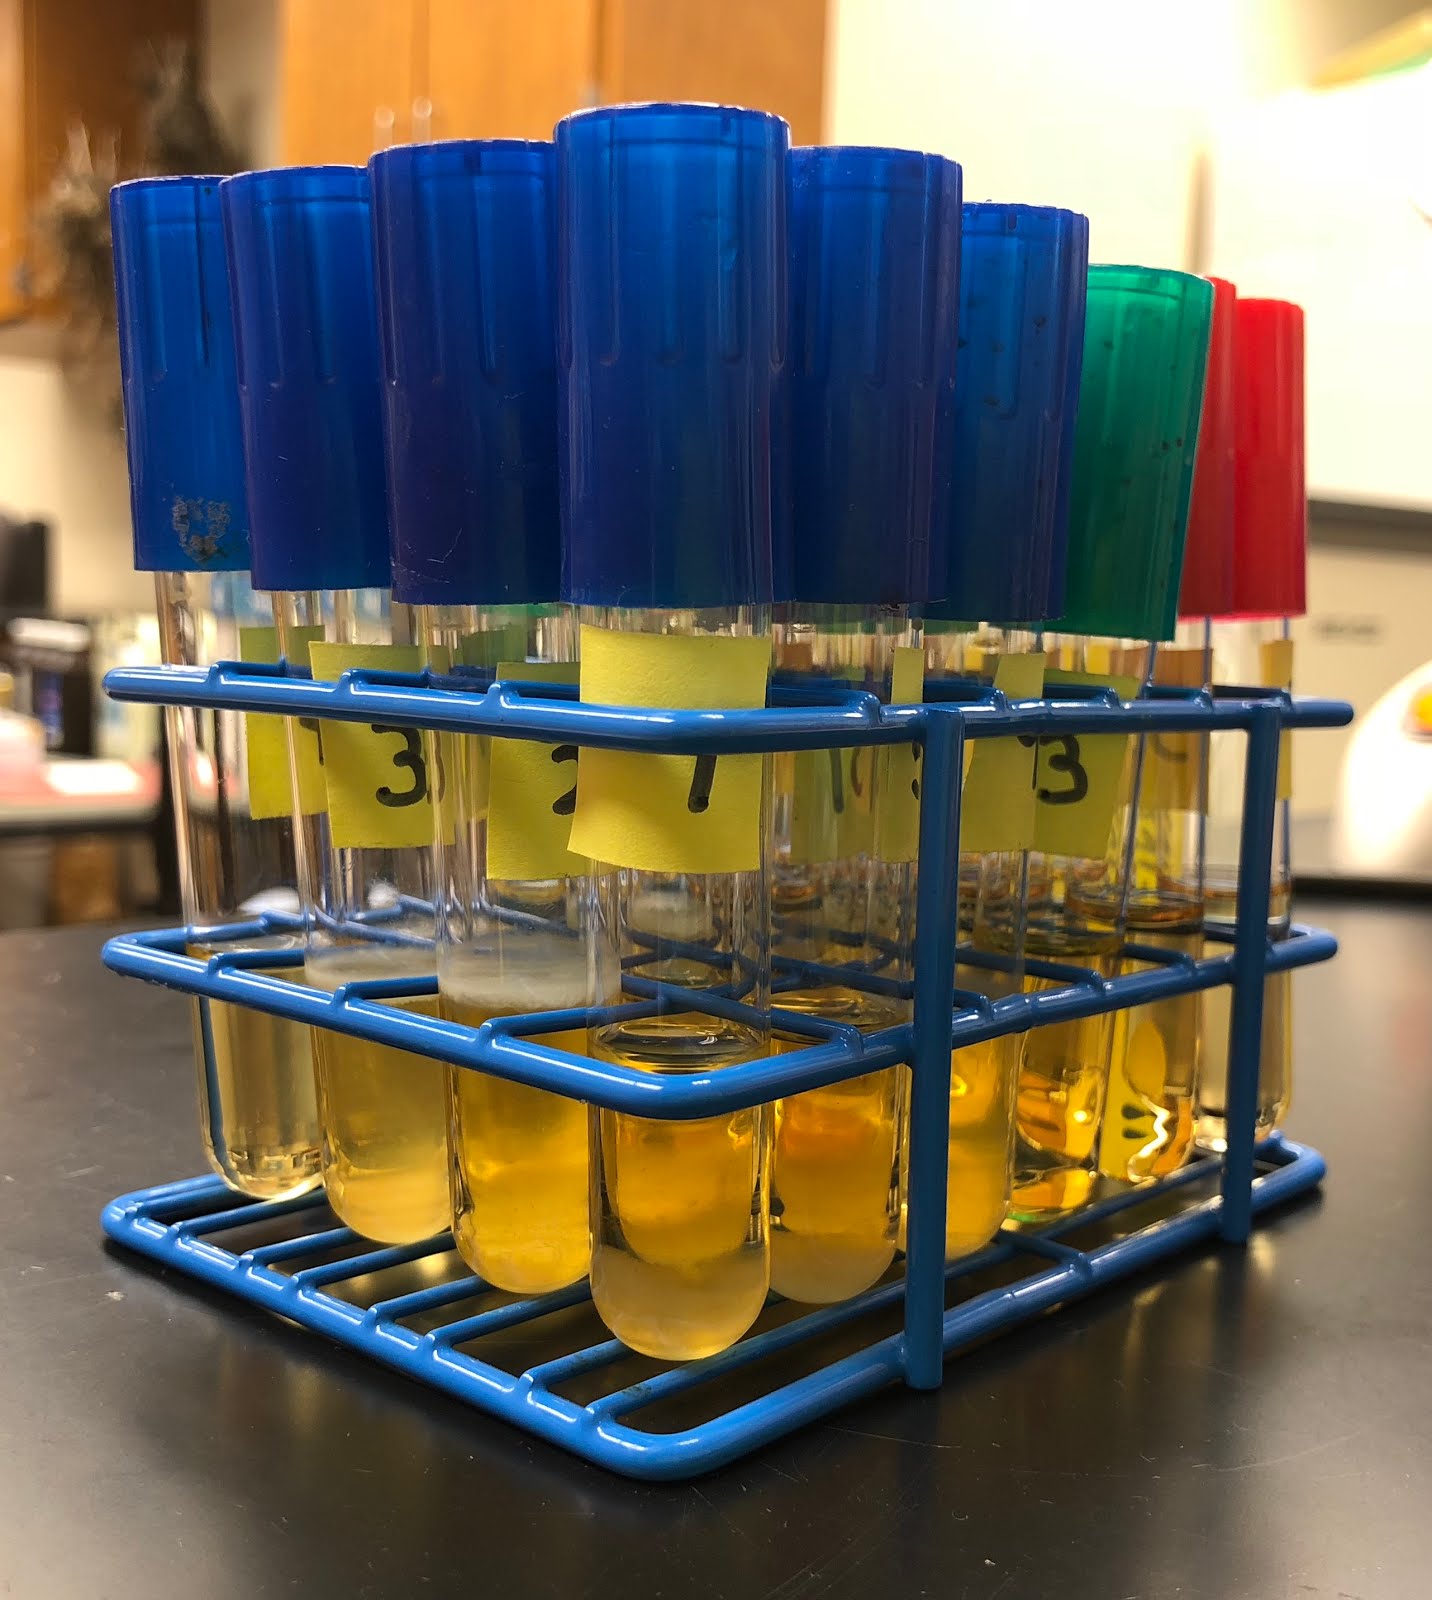 |
| Figure 1. The resulting TSB broth that was left at room temperature over the course of 5 days. These samples contained different unknown bacteria that was from a creosote bush. |
Thursday, November 9, 2017
Results... At Last!
On October 31, 2017, I ran my post-PCR DNA samples from October 26, 2017 under electrophoresis. Theses particular samples were different because I doubled everything, except the DNA. I added 20 microliters of Master Mix, 11 microliters of sterile water, 4 microliters of the forward primer, 4 microliters of the reverse primer and 1 microliter of DNA. All this totaled to an amount of 40 microliters. The primers used were 27F and 1492R. Once I ran these under electrophoresis, I finally got results (Figure 1)! I was so excited because at one point, I was beginning to think I was doing my procedures wrong. Nonetheless, I am happy to say that this change made a difference. Also, this week, I started growing bacteria in TSB broth (Figure 2) that was isolated by Samantha Faltermeier, an S-STEM intern. I will be performing DNA extraction and, eventually, PCR on these unknown bacteria!
 |
| Figure 1. The resulting gel after it was ran under electrophoresis. The post-PCR DNA in each row from left to right is as follows: MW Ruler, 1, 3, 4, 5, 6, 7, 8, 9, 10, 11, 12, 13 & E. Coli. The particular DNA that amplified were 4, 9, 10, 11, 12 & 13. These were the ones that showed bright bands. |
 |
| Figure 2. Unknown DNA samples from isolated bacteria in a Creosote bush. The samples were transferred from a TSA plate to these TSB broths. They are growing at room temperature and the samples are 1, 2, 3, 4, 5, 6, 7, 8, 9, 10, 11, 12, 13 & 14. |
Thursday, November 2, 2017
Project Background
What is currently known:
With the expansion of urban areas, figuring out what kind of bacteria grows on larrea tridentata is essential. This bacteria may or may not slowly kill a plant or seriously injure an animal or human. The same applies for wild larrea tridentata. However, there could be a possibility that the wild bacteria is beneficial to it and its surroundings. However, there is a chance that the certain bacteria is damaging to not only the plant but its environment as well. Figuring out which of the various species of bacteria are present will help lead to answer questions of interested. For instance, obtaining information about certain bacteria in urban and wild larrea tridentata can help explain why plant soil is toxic. An additional question of interest is whether there is a relationship between a species of bacteria and carbon monoxide. Could this potentially be one of the causes to the rise of carbon dioxide levels? Does the bacteria on these plants affect plants ability to obtain carbon dioxide? A study ran by L.P. Nguyen suggests that “the decrease in representation of Gram positives and the similar values for total bacterial DNA suggest that the representation of other bacterial taxa was promoted by elevated [CO2]” (Nguyen, 2011). Finding out whether or not carbon dioxide goes hand in hand with certain species of bacteria is valuable to know so that we can work together to reduce carbon dioxide levels and, thus, benefit living organisms (plants).
Currently, there are a wide range of research projects that have been conducted on larrea tridentata (creosote bush). In particular, a research carried by L.M. Nguyen and others, they were able to conclude that “the concentration of total bacteria 16S rDNA was similar in conditions of enriched and ambient [CO2]” (Nguyen, 2011). In other words, this particular DNA that is present in a creosote bush has a relationship with the amount of carbon dioxide. To support their findings, they noticed that “the decrease in representation of Gram positives and the similar values for total bacterial DNA suggest that the representation of other bacterial taxa was promoted by elevated [CO2]” (Nguyen, 2011). Another example involves an STD named herpes. Sandra Levy provided a the insight that there was a new product that was used to relieve symptoms. This product is Herp-Eeze, which “is a dietary supplement containing an extract of the plant Larrea tridentata” (Levy, 1999). In addition, it is also known that “arid ecosystems, which occupy about 20% of the earth's terrestrial surface area, have been predicted to be one of the most responsive ecosystem types to elevated atmospheric CO2 and associated global climate change” (Smith, 2000). Considering the fact the creosote bushes are located in a desert, this information does apply to it.
Importance to expand on this knowledge:
Importance to expand on this knowledge:
 |
| Larrea tridentata (creosote bush) ("Lady Bird Johnson Wildflower Center", n.d). |
References
Bell, J. (1989). The polymerase chain reaction. Immunology Today, 10(10), 351-355. Retrieved from ScienceDirect database.
Kuikman, P.J., & Van Veen, J.A. (1989). The impact of protozoa on the availability of bacterial nitrogen to plants. Biology and Fertility of Soils. https://doi.org/10.1007/BF00260510
Kembel, S. W., O’Connor, T. K., Arnold, H. K., Hubbell, S. P., Wright, S. J., & Green, J. L. (2012). Relationships between phyllosphere bacterial communities and plant functional traits in a neotropical forest. PNAS, 111(38), 13715-13720. https://doi: 10.1073/pnas.1216057111
Lady Bird Johnson Wildflower Center. (n.d.). Retrieved November 02, 2017, from https://www.wildflower.org/gallery/result.php?id_image=7711
Levy, S. (1999). Creosote bush in Arizona sprouts new herpes product. Drug Topics. Retrieved from General OneFile database.
Nguyen, L. M., Buttner, M. P., Cruz, P., Smith, S. D., & Robleto, E. A. (2011). Effects of elevated atmospheric CO2 on rhizosphere soil microbial communities in a Mojave Desert ecosystem. Journal of Arid Environments, 75(10), 917-925. Retrieved from Science Direct database.
Marques, J. M., da Silva, T. F., Vollu, R. E., Blank, A. F., Ding, G.-C., Seldin, L., & Smalla, K. (2014). Plant age and genotype affect the bacterial community composition in the tuber rhizosphere of field-grown sweet potato plants. FEMS Microbiology Ecology, 88(2), 424-435. https://doi.org/10.1111/1574-6941.12313
QuickExtract Bacterial DNA Extraction Kit. (n.d.). Retrieved from EpiBio website: http://www.epibio.com/docs/default-source/protocols/quickextract-bacterial-dna-extraction-kit.pdf?sfvrsn=8
Smith, S. D., Huxman, T. E., Zitzer, S. F., Charlet, T. N., Housman, D. C., Coleman, J. S., . . . Nowak, R. S. (2000). Elevated CO2 increases productivity and invasive species success in an arid ecosystem. Nature, 79-82. https://doi.org/10.1038/35040544
Stellwagen, N. C. (2009). Electrophoresis of DNA in agarose gels, polyacrylamide gels and in free solution. Electrophoresis, 30, S188-S195. https://doi.org/10.1002/elps.200900052
Steven, B., Gallegos-Graves, L. V., Yeager, C., Belnap, J., & Kuske, C. R. (2014). Common and distinguishing features of the bacterial and fungal communities in biological soil crusts and shrub root zone soils. Soil Biology and Biochemistry, 69, 302-312. Retrieved from ScienceDirect database.
Thursday, October 26, 2017
Electrophoresis & PCR
Honestly, I am trying to stay hopeful because I already want to identify what species of bacteria I am dealing with, even though I am having a bit of a tough time doing so. However, science isn’t always perfect and adjustments have to be made to further in research, even if they’re small. With that said, patience is definitely key in this project. Similar to the past few weeks, I performed PCR and electrophoresis. I ran my post-PCR samples from last week in a gel and the results are shown below in Figure 1. These samples contained 1 microliter of DNA and 5 microliters of water and even though most of the slots showed DNA, there were a few that didn’t. I then decided to switch primers, from the PCAT set to the 27F/1492R set. There’s a possibility that the reason the DNA isn’t showing is because it doesn’t work in the PCAT primer. In figure 2 are post-PCR samples in the 27F/1492R primer set ran under electrophoresis. Luckily, slot 11 had DNA amplification but the others still weren’t successful. Next week, I will continue using the 27F/1492R primer set for PCR and double the amount of master mix, primers and sterile water to have a total volume of 40 microliters, instead of the usual 20. The amount of DNA in each PCR sample will stay at 1 microliter.
 |
| Figure 1. Electrophoresis results when adding post-PCR samples into each slot in the PCAT primer set. From left to right, the material in the slots are: MW Ruler, 1, 3, 4, 5, 6, 7, 8, 9, 10, 11, 12, 13, and 14. The bands that are shown could possibly be the primers. |
 |
| Figure 2. Electrophoresis results when adding post-PCR samples into each slot in the 27F/1492R primer set. From left to right, the material in the slots are: MW Ruler, 1, 3, 4, 5, 6, 7, 8, 9, 10, 11, 12, 13, and E. Coli. The only slot that showed DNA amplification was slot 11, which contained DNA from the unknown bacteria #12. |
Thursday, October 19, 2017
PCR and Electrophoresis... Again
Similar to the past 3 weeks or so, I performed electrophoresis and PCR. Slowly but surely, I am making some progress. Last week, I had electrophoresis results that were quite useless. As a reminder, I obtained gels that did not have any visible DNA. After figuring out what the problem was, which was that the SyberGreen-DNA was old/bad, I created another gel and used new SyberGreen-DNA. After obtaining the results, my DNA still wasn’t visible (Figure 1). I then adjusted the amount of post-PCR DNA each slot had from 4 mircoliters to 20 microliters. Finally, this adjustment did show DNA but not for all of my samples (Figure 2). In order to try to get all of the slots to show DNA, instead of using 2 mircoliters of DNA during PCR, I dropped the amount to 1 mircoliter. I will run these samples under electrophoresis next week and hopefully all the slots show DNA!
 |
| Figure 1. Electrophoresis results after using new SyberGreen-DNA. The order of the slots, from left to right is as follows: MW Ruler, 1, 3, 4, 5, 6, 7, 8, 9, 10, 11, 12, 13 and 14. The post-PCR DNA samples were in PCAT primer set. |
 |
| Figure 2. Electrophoresis results after using 20 microliters of post-PCR DNA in each slot. The order of the slots, from left to right is as follows: MW Ruler, 1, 3, 4, 5, 6, 7, 8, 9, 10, 11, 12, 13 and 14. The post-PCR DNA samples were in PCAT primer set. |
Thursday, October 12, 2017
Continuance of PCR and Electrophoresis
Similar to last week, this week consisted of performing PCR and electrophoresis. However, even though last week’s gel was well done (Figure 1.), it was useless because the PCR primers I used were too concentrated. This resulted in only the primers showing in the gel and not the DNA. In order to dilute the primers from 100X to 1X (concentration), I mixed 1 microliter of a specified primer with 19 microliters of sterile water. Again, this gave me much less concentrated primers and as a result, I should have obtained gels with visible DNA samples. However, that did not occur. Below in Figures 2, 3 and 4 are gels that were ran with post-PCR DNA samples in 1x primers. Figure 2 had Sybergreen-DNA in the gel while Figures 1, 3 and 4 had Sybergreen-DNA mixed with each DNA sample. Sybergreen-DNA is needed because it helps DNA fluorescent, which makes it possible to see. Nonetheless, I still did not have any DNA samples show no matter where the Sybergreen-DNA was. Next week, I will try to figure out what the problem was so that I am able to obtain successful electrophoresis results!
 |
| Figure 1. Agarose gel after electrophoresis. In the slots, in order from left to right, are MW Ruler, 1, 3, 4, 5, 6, 7, 8, 9, 10, 11, 12, 13 and 14. The mentioned numbers are post-PCR DNA samples with highly (100X) concentrated PCAT-4F-2015 and PCAT-4R-2015 primers from October 5, 2017 PCR run. Sybergreen-DNA was mixed into each DNA sample. |
 |
| Figure 2. Agarose gel after electrophoresis. In the slots, in order from left to right, are MW Ruler, EC (from October 5, 2017 run), 3, 4, 5, 6, 7, 8, 9, 10, 11, 12 and 13. The mentioned numbers are post-PCR DNA samples with low (1X) concentrated PCAT-4F-2015 and PCAT-4R-2015 primers. Sybergreen-DNA was inserted into the gel. |
 |
| FIgure 3. Agarose gel after electrophoresis. In the slots, in order from left to right, are MW Ruler, EC (from October 5, 2017 run), 3, 4, 5, 6, 7, 8, 9, 10, 11, 12 and 13. The mentioned numbers are post-PCR DNA samples with low (1X) concentrated PCAT-4F-2015 and PCAT-4R-2015 primers. Sybergreen-DNA was mixed into each DNA sample. |
 |
| Figure 4. Agarose gel after electrophoresis. In the slots, in order from left to right, are MW Ruler, 14, EC, 1, 3, 4, 5, 6, 7, 8, 9, 10, 11 and 12. The first two samples (14 and EC) are in the PCAT primer set and the ones following these are all in 27F-1492R primers. The mentioned numbers are post-PCR DNA samples with low (1X) concentrated primers. Sybergreen-DNA was mixed into each DNA sample. |
Subscribe to:
Posts (Atom)