Pages

Tuesday, April 17, 2018

Final Poster

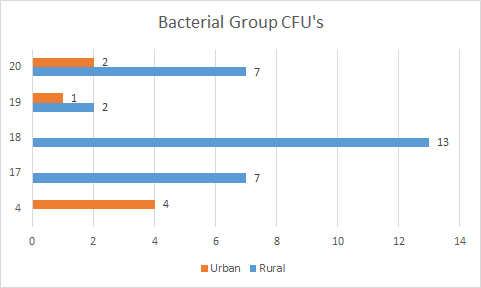
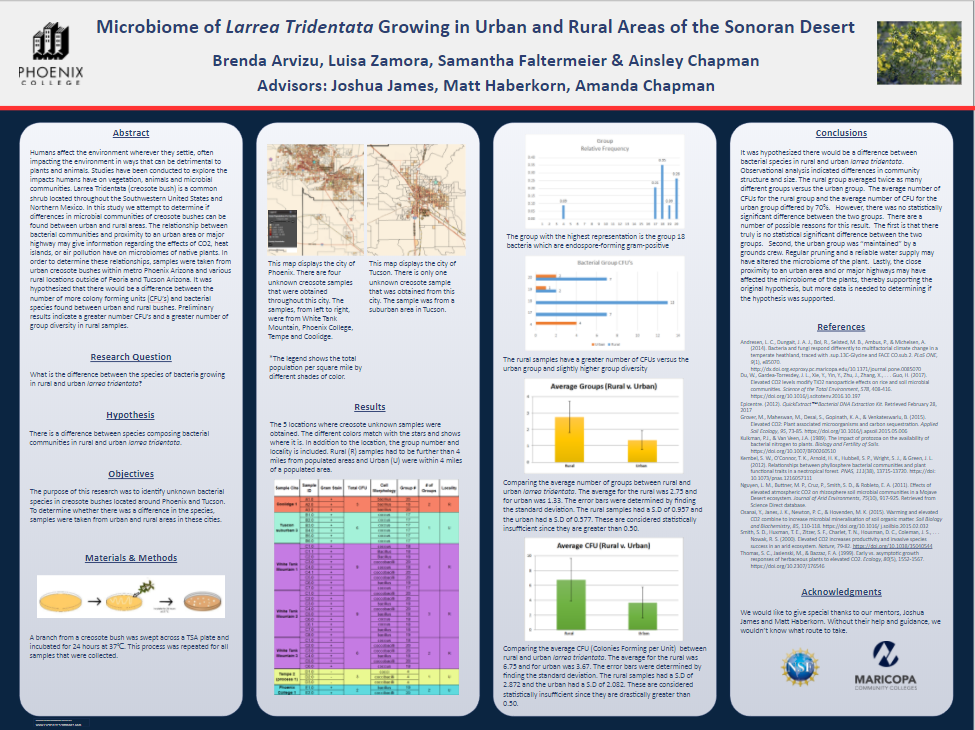
The semester is coming to an end and I forgot to mention my results for this research project. After looking at our data, the rural group had twice as many bacterial groups compared to the urban. In addition, the average number of Colony Forming Units (CFU) of the urban samples differed by about 70% (Figure 1). However, there is no significant statistical difference between bacterial species in urban and rural areas. More research and samples will need to be gathered in order to determine a statistical difference between the two groups. Other than that, I am content with my poster (Figure 2) and am excited to present at the University of Nevada! I wish my fellow interns the best of luck during their presentations and I hope we have a fun, safe trip!

Figure 1. The rural samples have a greater number of CFUs vs. the urban group and a slightly higher group diversity (2 more groups than urban).
Figure 2. Final poster for the Spring 2018 research project. 


Thursday, April 12, 2018

Semi-Finished Poster

I seriously enjoy working on anything that involves presentations! I love making posters unique, nice to look at and easy to read. I’ve mentioned this before but I think this has to do with my past experience with graphic design. I definitely paid close attention towards this poster when it came to color, font, text size and text placement. (Figure 1). Unfortunately, I am not too sure about the color because it looks very similar to last year’s and I wanted to switch it up. Also, the placement of the results has not convinced me. I will continue editing and will post the final product!
Figure 1. My 2018 research poster (that may still need corrections).

Thursday, April 5, 2018

Slow Weeks

To be honest, for the last couple of weeks, I have had difficulty writing blog posts about my research. I have not been performing DNA extraction since the first 2 extractions because they had similar results. Also, I am unable to perform PCR because I do not have the PCR primers. The primers (27F/1492R, V3F/V3R, V6F/V6R) were ordered this week and should be here in a couple of weeks. Once they arrive, I will then be able to perform PCR, continue my research and hopefully identify the unknown bacteria. In the meantime, I have been editing my research poster to present at the Arizona-Nevada Academy Conference on April 21, 2018.

Figure 1. The Arizona-Nevada Academy of Science and the Arizona/ Southern Nevada Branch of the American Society of Microbiology will host the 62nd meeting at the University of Las Vegas ("Joint Science...", n.d.). 

Joint Science and Mathematics Meeting. (n.d.). Retrieved April 05, 2018, from https://www.aznvas.org/meeting/details/

Thursday, March 29, 2018

Possible PCR Primers

I was able to narrow possible PCR primers down to about 3 pairs. It turns out, I do
not have to necessarily make my own primers, I can use primers that have already
been created to test them out. With this in mind, after researching universal primers,
I have decided to use a pair of PCR primers from last semester and 2 new ones. The
ones from last semester were 27F and 1492R. The primers I want to test are V3F,
V3R, V6F and V6R. Each primer has a specific sequence that will be replicated and
it can be seen in Figure 1. I found it interesting that the new primers have lowercase
letters in their sequence. After researching why this could be, thinking it could have
possibly been a typo, I found that lowercase letters can mean “low-complexity or
repetitive elements” (“Legend: Fasta”, n.d.).

Figure 1. The possible PCR primers that I plan to use during PCR. There are 6 in total, equaling 3 pairs. The sequences are listed next to each one starting from 5' and ending at 3'. 

Legend: Fasta. (n.d.). Retrieved March 30, 2018, from
https://www.ncbi.nlm.nih.gov/SNP/snp_legend.cgi?legend=fasta
Chakravorty, S., Helb, D., Burday, M., Connell, N., & Alland, D. (2007). A detailed analysis of 16S ribosomal RNA gene segments for the diagnosis of pathogenic bacteria. Journal of Microbiological Methods, 69(2), 330-339. https://doi.org/10.1016/j.mimet.2007.02.005
Thursday, March 22, 2018

PCR Primers

This week was quite slow because I have been researching possible PCR primers to
use for Polymerase Chain Reaction (PCR). The next step of my research is to
perform this but I cannot do so without these primers. With that said, I have to
develop my own primers from researching articles and protocols.. Even though I
am looking for universal primers, it is a little difficult to determine which one
would be best because certain ones work for certain bacteria or environments.
Since I am trying to identify unknown bacteria, I will most like have to develop
more than one primer. For example, one primer for gram positive bacteria and
another for gram negative bacteria. I will continue my research and hopefully
begin PCR next week!

Figure 1. The materials and process of Polymerase Chain Reaction (PCR). During PCR, the specific DNA that the primer targets is replicated over and over. If the primer cannot find that DNA, it means the sample does not have it and vis versa. ("PCR", n.d.).


PCR. (n.d.). Retrieved March 23, 2018, from
http://ib.bioninja.com.au/standard-level/topic-3-genetics/35-genetic-modification-
and/pcr.html

Thursday, March 8, 2018

Preparation of Research Poster

I started to prepare my poster for the upcoming research presentations. A few of them that I hope to present at will be the Estrella Mountain Conference, ASU Symposium and Arizona-Nevada Academy of Science Conference. I have already included items such as the hypothesis and abstract but still need to include my data. For instance, I have to provide a map that includes the locations each unknown sample was taken from (attached below). In addition, most of the bacteria from last semester’s were categorized in bacterial group numbers (attached below). I will make sure to upload my poster once I have it completed!

Figure 1. The 5 locations where creosote unknown samples from last semester's research project were obtained. The different colors match with the stars on the following maps and shows where it is. In addition to the location, the group number and locality is included. Rural (R) samples had to be further than 4 miles from populated areas and Urban (U) where within 4 miles of a populated area.  

Figure 2. The legend to the following maps that display the location of the creosote bush unknown samples. This also shows the total population per square mile by different shades of color.
Figure 3. This map displays the city of Phoenix. There are four unknown creosote samples that were obtained throughout this city. The samples, from left to right, were from White Tank Mountain, Phoenix College, Tempe and Coolidge. 

Figure 4. This map displays the city of Tucson. There is only one unknown creosote sample that was obtained from this city. The sample was from a suburban area in Tucson. 


Thursday, March 1, 2018

Second DNA Extraction


This week, I performed the second DNA extraction on the unknown Larrea Tridentata bacteria. I was unsatisfied with the results I obtained a couple of weeks ago because the NanoDrop DNA values were low (well, at least to me). Due to these results, I thought I had done something wrong. With this in mind, I was hoping to get higher amounts of DNA during this extraction. However, that was not the case because I practically had about the same amount of nucleic acid. After this extraction, nothing changed and I will be using these samples for PCR. Below is the nucleic acid graph and data table for this second extraction (Group B).

Figure 1. The NanoDrop data collected from unknown bacteria in creosote bushes (group B). Five DNA extracted samples were used: A1, A8, A24, A26 and A27. Displayed with each bacteria is the amount of nucleic acid, 260 ratio, 280 ratio and260/280.

Figure 2. The NanoDrop graph from unknown bacteria in creosote bushes. The five displayed DNA extracted samples, A1B, A8B, A24B, A26B and A27B, are shown, along with the wavelength and the absorbance.