 |
| Figure 1. Presenting the research project I conducted this semester in front of S-STEM interns and faculty. |
Thursday, December 7, 2017
Goodbye 2017, Hello 2018.
After a long, stressful and fun semester at S-STEM, it has officially come to an end. I must say, this research project was quite a ride. For instance, results disappointed me but somehow, when I had lost most of my hope, they surprised me. I also met new interns while also building relationships with previous friends. This semester was not that much different from the last because I was, and still am, happy. Everyone is so friendly and I am so grateful to have such an amazing opportunity. Since the year is ending, this week was dedicated to preparing for my presentation and finalizing my research paper. Hopefully I will be able to continue my research next semester but if not, I’ll have to see what’s in store! See you next year :P
Thursday, November 30, 2017
Missing Bacterial DNA
Unfortunately, I found out about two weeks ago that the DNA I had extracted from my unknown bacteria was missing. I know I had not misplaced it or threw it away because I remember putting it back where it always goes. I had not mentioned it before because I thought that it would eventually turn up. However, that was not the case and I am quite upset about it because I am almost certain that it was not a mistake I made. With that said, there was no further advancement in my research project this week. Instead, I was preparing and creating a PowerPoint about my research, along with adding more information to my final paper. As far as I am concerned, I will present this PowerPoint in front of other STEM interns and Bioscience faculty. I guess I am going to have to find out for myself in a couple of weeks!
 |
| Figure 1. Possible PowerPoint theme for the research project that was carried during the Fall 2017 S-STEM internship. It will be titled "Identification of Bacteria Isolated From Wild and Urban Larrea Tridentata Utilizing RS-16 Sequencing". |
Thursday, November 16, 2017
Additional Unknown Bacteria
From last week’s broth, the resulting broth that was left at room temperature over the weekend is seen in Figure 1. In addition, this week, I grew Samantha Faltermeier’s unknown bacteria in TSB broth. The bacteria that I am working with has been isolated on a TSA plate from a creosote bush. As a side note, this bacteria is quite interesting because they all seem to be different. For instance, some have a horrible stench, while others don’t. Also, some almost look like snowflakes and some look like a typical round bacterial colony. As mentioned last week, I performed DNA extraction on these unknowns. Next week, if I am able to, PCR and electrophoresis are the next steps!
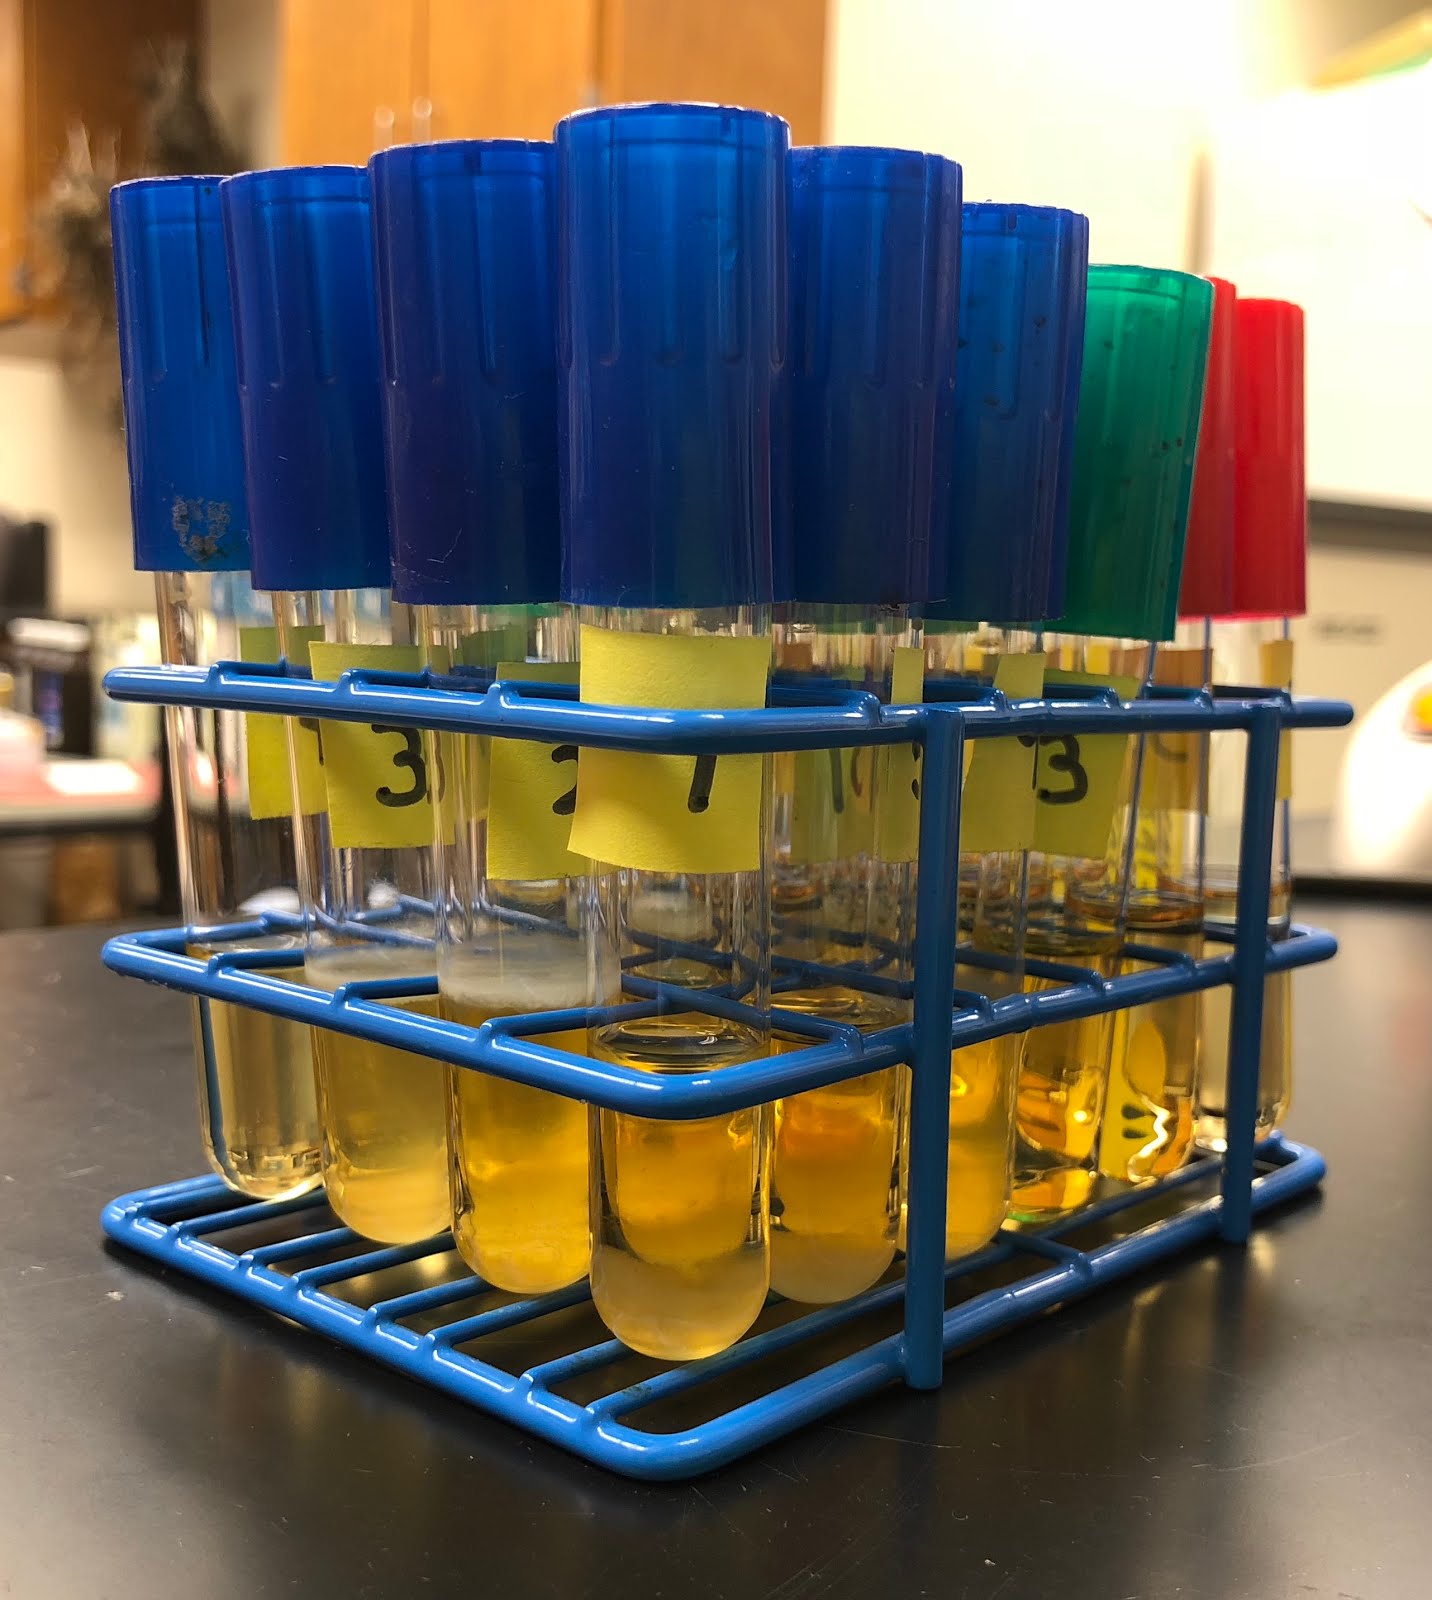 |
| Figure 1. The resulting TSB broth that was left at room temperature over the course of 5 days. These samples contained different unknown bacteria that was from a creosote bush. |
Thursday, November 9, 2017
Results... At Last!
On October 31, 2017, I ran my post-PCR DNA samples from October 26, 2017 under electrophoresis. Theses particular samples were different because I doubled everything, except the DNA. I added 20 microliters of Master Mix, 11 microliters of sterile water, 4 microliters of the forward primer, 4 microliters of the reverse primer and 1 microliter of DNA. All this totaled to an amount of 40 microliters. The primers used were 27F and 1492R. Once I ran these under electrophoresis, I finally got results (Figure 1)! I was so excited because at one point, I was beginning to think I was doing my procedures wrong. Nonetheless, I am happy to say that this change made a difference. Also, this week, I started growing bacteria in TSB broth (Figure 2) that was isolated by Samantha Faltermeier, an S-STEM intern. I will be performing DNA extraction and, eventually, PCR on these unknown bacteria!
 |
| Figure 1. The resulting gel after it was ran under electrophoresis. The post-PCR DNA in each row from left to right is as follows: MW Ruler, 1, 3, 4, 5, 6, 7, 8, 9, 10, 11, 12, 13 & E. Coli. The particular DNA that amplified were 4, 9, 10, 11, 12 & 13. These were the ones that showed bright bands. |
 |
| Figure 2. Unknown DNA samples from isolated bacteria in a Creosote bush. The samples were transferred from a TSA plate to these TSB broths. They are growing at room temperature and the samples are 1, 2, 3, 4, 5, 6, 7, 8, 9, 10, 11, 12, 13 & 14. |
Thursday, November 2, 2017
Project Background
What is currently known:
With the expansion of urban areas, figuring out what kind of bacteria grows on larrea tridentata is essential. This bacteria may or may not slowly kill a plant or seriously injure an animal or human. The same applies for wild larrea tridentata. However, there could be a possibility that the wild bacteria is beneficial to it and its surroundings. However, there is a chance that the certain bacteria is damaging to not only the plant but its environment as well. Figuring out which of the various species of bacteria are present will help lead to answer questions of interested. For instance, obtaining information about certain bacteria in urban and wild larrea tridentata can help explain why plant soil is toxic. An additional question of interest is whether there is a relationship between a species of bacteria and carbon monoxide. Could this potentially be one of the causes to the rise of carbon dioxide levels? Does the bacteria on these plants affect plants ability to obtain carbon dioxide? A study ran by L.P. Nguyen suggests that “the decrease in representation of Gram positives and the similar values for total bacterial DNA suggest that the representation of other bacterial taxa was promoted by elevated [CO2]” (Nguyen, 2011). Finding out whether or not carbon dioxide goes hand in hand with certain species of bacteria is valuable to know so that we can work together to reduce carbon dioxide levels and, thus, benefit living organisms (plants).
Currently, there are a wide range of research projects that have been conducted on larrea tridentata (creosote bush). In particular, a research carried by L.M. Nguyen and others, they were able to conclude that “the concentration of total bacteria 16S rDNA was similar in conditions of enriched and ambient [CO2]” (Nguyen, 2011). In other words, this particular DNA that is present in a creosote bush has a relationship with the amount of carbon dioxide. To support their findings, they noticed that “the decrease in representation of Gram positives and the similar values for total bacterial DNA suggest that the representation of other bacterial taxa was promoted by elevated [CO2]” (Nguyen, 2011). Another example involves an STD named herpes. Sandra Levy provided a the insight that there was a new product that was used to relieve symptoms. This product is Herp-Eeze, which “is a dietary supplement containing an extract of the plant Larrea tridentata” (Levy, 1999). In addition, it is also known that “arid ecosystems, which occupy about 20% of the earth's terrestrial surface area, have been predicted to be one of the most responsive ecosystem types to elevated atmospheric CO2 and associated global climate change” (Smith, 2000). Considering the fact the creosote bushes are located in a desert, this information does apply to it.
Importance to expand on this knowledge:
Importance to expand on this knowledge:
 |
| Larrea tridentata (creosote bush) ("Lady Bird Johnson Wildflower Center", n.d). |
References
Bell, J. (1989). The polymerase chain reaction. Immunology Today, 10(10), 351-355. Retrieved from ScienceDirect database.
Kuikman, P.J., & Van Veen, J.A. (1989). The impact of protozoa on the availability of bacterial nitrogen to plants. Biology and Fertility of Soils. https://doi.org/10.1007/BF00260510
Kembel, S. W., O’Connor, T. K., Arnold, H. K., Hubbell, S. P., Wright, S. J., & Green, J. L. (2012). Relationships between phyllosphere bacterial communities and plant functional traits in a neotropical forest. PNAS, 111(38), 13715-13720. https://doi: 10.1073/pnas.1216057111
Lady Bird Johnson Wildflower Center. (n.d.). Retrieved November 02, 2017, from https://www.wildflower.org/gallery/result.php?id_image=7711
Levy, S. (1999). Creosote bush in Arizona sprouts new herpes product. Drug Topics. Retrieved from General OneFile database.
Nguyen, L. M., Buttner, M. P., Cruz, P., Smith, S. D., & Robleto, E. A. (2011). Effects of elevated atmospheric CO2 on rhizosphere soil microbial communities in a Mojave Desert ecosystem. Journal of Arid Environments, 75(10), 917-925. Retrieved from Science Direct database.
Marques, J. M., da Silva, T. F., Vollu, R. E., Blank, A. F., Ding, G.-C., Seldin, L., & Smalla, K. (2014). Plant age and genotype affect the bacterial community composition in the tuber rhizosphere of field-grown sweet potato plants. FEMS Microbiology Ecology, 88(2), 424-435. https://doi.org/10.1111/1574-6941.12313
QuickExtract Bacterial DNA Extraction Kit. (n.d.). Retrieved from EpiBio website: http://www.epibio.com/docs/default-source/protocols/quickextract-bacterial-dna-extraction-kit.pdf?sfvrsn=8
Smith, S. D., Huxman, T. E., Zitzer, S. F., Charlet, T. N., Housman, D. C., Coleman, J. S., . . . Nowak, R. S. (2000). Elevated CO2 increases productivity and invasive species success in an arid ecosystem. Nature, 79-82. https://doi.org/10.1038/35040544
Stellwagen, N. C. (2009). Electrophoresis of DNA in agarose gels, polyacrylamide gels and in free solution. Electrophoresis, 30, S188-S195. https://doi.org/10.1002/elps.200900052
Steven, B., Gallegos-Graves, L. V., Yeager, C., Belnap, J., & Kuske, C. R. (2014). Common and distinguishing features of the bacterial and fungal communities in biological soil crusts and shrub root zone soils. Soil Biology and Biochemistry, 69, 302-312. Retrieved from ScienceDirect database.
Thursday, October 26, 2017
Electrophoresis & PCR
Honestly, I am trying to stay hopeful because I already want to identify what species of bacteria I am dealing with, even though I am having a bit of a tough time doing so. However, science isn’t always perfect and adjustments have to be made to further in research, even if they’re small. With that said, patience is definitely key in this project. Similar to the past few weeks, I performed PCR and electrophoresis. I ran my post-PCR samples from last week in a gel and the results are shown below in Figure 1. These samples contained 1 microliter of DNA and 5 microliters of water and even though most of the slots showed DNA, there were a few that didn’t. I then decided to switch primers, from the PCAT set to the 27F/1492R set. There’s a possibility that the reason the DNA isn’t showing is because it doesn’t work in the PCAT primer. In figure 2 are post-PCR samples in the 27F/1492R primer set ran under electrophoresis. Luckily, slot 11 had DNA amplification but the others still weren’t successful. Next week, I will continue using the 27F/1492R primer set for PCR and double the amount of master mix, primers and sterile water to have a total volume of 40 microliters, instead of the usual 20. The amount of DNA in each PCR sample will stay at 1 microliter.
 |
| Figure 1. Electrophoresis results when adding post-PCR samples into each slot in the PCAT primer set. From left to right, the material in the slots are: MW Ruler, 1, 3, 4, 5, 6, 7, 8, 9, 10, 11, 12, 13, and 14. The bands that are shown could possibly be the primers. |
 |
| Figure 2. Electrophoresis results when adding post-PCR samples into each slot in the 27F/1492R primer set. From left to right, the material in the slots are: MW Ruler, 1, 3, 4, 5, 6, 7, 8, 9, 10, 11, 12, 13, and E. Coli. The only slot that showed DNA amplification was slot 11, which contained DNA from the unknown bacteria #12. |
Thursday, October 19, 2017
PCR and Electrophoresis... Again
Similar to the past 3 weeks or so, I performed electrophoresis and PCR. Slowly but surely, I am making some progress. Last week, I had electrophoresis results that were quite useless. As a reminder, I obtained gels that did not have any visible DNA. After figuring out what the problem was, which was that the SyberGreen-DNA was old/bad, I created another gel and used new SyberGreen-DNA. After obtaining the results, my DNA still wasn’t visible (Figure 1). I then adjusted the amount of post-PCR DNA each slot had from 4 mircoliters to 20 microliters. Finally, this adjustment did show DNA but not for all of my samples (Figure 2). In order to try to get all of the slots to show DNA, instead of using 2 mircoliters of DNA during PCR, I dropped the amount to 1 mircoliter. I will run these samples under electrophoresis next week and hopefully all the slots show DNA!
 |
| Figure 1. Electrophoresis results after using new SyberGreen-DNA. The order of the slots, from left to right is as follows: MW Ruler, 1, 3, 4, 5, 6, 7, 8, 9, 10, 11, 12, 13 and 14. The post-PCR DNA samples were in PCAT primer set. |
 |
| Figure 2. Electrophoresis results after using 20 microliters of post-PCR DNA in each slot. The order of the slots, from left to right is as follows: MW Ruler, 1, 3, 4, 5, 6, 7, 8, 9, 10, 11, 12, 13 and 14. The post-PCR DNA samples were in PCAT primer set. |
Thursday, October 12, 2017
Continuance of PCR and Electrophoresis
Similar to last week, this week consisted of performing PCR and electrophoresis. However, even though last week’s gel was well done (Figure 1.), it was useless because the PCR primers I used were too concentrated. This resulted in only the primers showing in the gel and not the DNA. In order to dilute the primers from 100X to 1X (concentration), I mixed 1 microliter of a specified primer with 19 microliters of sterile water. Again, this gave me much less concentrated primers and as a result, I should have obtained gels with visible DNA samples. However, that did not occur. Below in Figures 2, 3 and 4 are gels that were ran with post-PCR DNA samples in 1x primers. Figure 2 had Sybergreen-DNA in the gel while Figures 1, 3 and 4 had Sybergreen-DNA mixed with each DNA sample. Sybergreen-DNA is needed because it helps DNA fluorescent, which makes it possible to see. Nonetheless, I still did not have any DNA samples show no matter where the Sybergreen-DNA was. Next week, I will try to figure out what the problem was so that I am able to obtain successful electrophoresis results!
 |
| Figure 1. Agarose gel after electrophoresis. In the slots, in order from left to right, are MW Ruler, 1, 3, 4, 5, 6, 7, 8, 9, 10, 11, 12, 13 and 14. The mentioned numbers are post-PCR DNA samples with highly (100X) concentrated PCAT-4F-2015 and PCAT-4R-2015 primers from October 5, 2017 PCR run. Sybergreen-DNA was mixed into each DNA sample. |
 |
| Figure 2. Agarose gel after electrophoresis. In the slots, in order from left to right, are MW Ruler, EC (from October 5, 2017 run), 3, 4, 5, 6, 7, 8, 9, 10, 11, 12 and 13. The mentioned numbers are post-PCR DNA samples with low (1X) concentrated PCAT-4F-2015 and PCAT-4R-2015 primers. Sybergreen-DNA was inserted into the gel. |
 |
| FIgure 3. Agarose gel after electrophoresis. In the slots, in order from left to right, are MW Ruler, EC (from October 5, 2017 run), 3, 4, 5, 6, 7, 8, 9, 10, 11, 12 and 13. The mentioned numbers are post-PCR DNA samples with low (1X) concentrated PCAT-4F-2015 and PCAT-4R-2015 primers. Sybergreen-DNA was mixed into each DNA sample. |
 |
| Figure 4. Agarose gel after electrophoresis. In the slots, in order from left to right, are MW Ruler, 14, EC, 1, 3, 4, 5, 6, 7, 8, 9, 10, 11 and 12. The first two samples (14 and EC) are in the PCAT primer set and the ones following these are all in 27F-1492R primers. The mentioned numbers are post-PCR DNA samples with low (1X) concentrated primers. Sybergreen-DNA was mixed into each DNA sample. |
Thursday, October 5, 2017
Performing Electrophoresis
Last week, the reason I had to wait for my primers to perform PCR (Polymerase Chain Reaction) was because they play an important role. During PCR, these primers target a specific DNA code (Figure 1) and replicate this chain over and over again. This is what happened last week and this week, I used my PCR samples to perform electrophoresis. This process is performed in an agarose gel as electrical currents run through it. At the top, near the DNA slots, it is negatively charged and at the bottom, it is positively charged. Since DNA is negatively charged and considering the fact that opposite charges attract, the DNA is supposed to run towards the positively charged side. Shown below in Figure 2 is the result of my agarose gel after performing electrophoresis.
 |
| Figure 1. The primers that will be used to perform PCR and the distinct DNA code each one will target and copy. The values in the 3rd column are the necessary amounts of Tris Hydrochloride needed to be added to each primer before PCR. |
 |
| Figure 2. The result of an agarose gel after electrophoresis. Looking at the slots at the top, from left to right, the slots contain MW Ruler, 1, 3, 4, 5, 6, 7, 8, 9, 10, 11, 12, 13 & 14 (all of the numerical values are post-PCR DNA samples). |
Friday, September 29, 2017
Starting PCR
After waiting a week for the primers to arrive, I was finally able to start PCR. However, before I began, I had to prepare my primers. By doing so, I had to centrifuge them, add the designated amount of Tris Hydrochloride to each primer (Figure 1) and shake like crazy! This process took about 4 hours because I had to make sure my primers were completely mixed with the Tris Hydrochloride (thus, ready to use). After I prepared my primers, I set up my samples for PCR. Each PCR tube required 10 microliters of 2X Master Mix for PCR, 2 microliters of the forward primer, 2 microliters of the reverse primer, 4 microliters of sterile water and 2 microliters of DNA (from my bacteria samples). For this PCR run, I used the PCAT-4f-2015 and PCAT-4r-2015 primers (they are a set). After I had all of my samples, I set them into the PCR machine, ran the “PAUL” PCR protocol and collected them when they were finished (Figure 2). Next week, I will be using the next set of primers: 27F and 1492R.
 |
| Figure 1. From left to right, PCAT-4r-2015, PCAT-4f-2015, 27F, 1492R and Tris Hydrochloride. The first 4 are the primers I will be working with and the last item is the solvent the primers needed to be dissolved in. |
 |
| Figure 2. Collected samples after PCR was complete. The DNA samples used were from Group A (except for #12, which was from Group C). |
Thursday, September 21, 2017
Unknown Creosote Bush Bacteria
This week, I performed a third and final DNA extraction (Group C). These values varied from the last two (Group A and Group B) because some values were high and others were low. Considering that I have enough DNA from Group A to perform PCR, I decided to call it quits after I received the data from Group C. Attached below is the nucleic data from Group A, B and C. Aside from that, because I cannot perform PCR without master primers (which will arrive next week and is my next step), I retrieved a leaf from a creosote bush and carried out tests to try to determine what kind of bacteria was present. I liked running these tests because not only are they simple but they reminded me of my first semester at S-STEM. Sometime this week, I will hopefully be able to determine what kind of bacteria I’m dealing with!
 |
| Figure 1. The first DNA extraction group (Group A) from unknown bacteria, which had relatively high nucleic acid (DNA) compared to the others. |
 |
| Figure 2. The second DNA extraction group (Group B) from unknown bacteria, which had relatively high nucleic acid (DNA) compared to the others. |
 |
| Figure 3. The third DNA extraction group (Group C) from unknown bacteria, which had relatively high and low nucleic acid (DNA) compared to the others. |
 |
| Figure 4. The graph of the third DNA extraction results (group C) displaying how much was absorbed during a certain wavelength. The colorful numbers to the left side correspond to the bacteria it is. "EC" stands for E.Coli, which is being used as the positive control. Note that the absorbance goes up to about 32. |
 |
| Figure 5. Unknown bacteria from a creosote bush under the microscope after gram staining. This bacteria is gram + (because it is purple) and cocci shaped (the cell shape is circular). |
Thursday, September 14, 2017
Bump on the Road
For some reason, I didn’t feel like myself this week because I would do little mistakes here and there (which I do my best to avoid). For example, when working on the QuickExtract DNA Extraction protocol, I would make a few mistakes that made a huge difference. For instance, the first step after centrifuging the bacteria is to remove the supernatant and then add sterile water. Instead, I did not remove the supernatant and added the sterile water, causing it to mix. This resulted in a low amount of DNA (Figure 1). I committed another mistake when I attempted to fix my first one. This time, I lowered the amount of bacteria I used and immediately put away my finished DNA in the refrigerator (when it should be left at room temperature for awhile). This error gave me an even less amount of DNA (Figure 2). Of course, I was bummed out (and still am) but I will be returning to take my time and pay close attention to what I’m doing. As the saying goes, you learn from your mistakes!
 |
| Figure 1. The graph of the first DNA extraction results (group A) displaying how much was absorbed during a certain wavelength. The colorful numbers to the left side correspond to the bacteria it is. "EC" stands for E.Coli, which is being used as the positive control. Note that the absorbance goes up to 40. |
 | |
|
Thursday, September 7, 2017
QuickExtract Protocol
This week, I focused on transferring grown bacteria from the TSA plates into a broth and then performing a DNA extraction method (shown below). The protocol used was the QuickExtract Bacterial DNA Extraction Kit, which was the control in my project last semester (it gave me the most amount of DNA). Like it’s name, this method is quick and quiet simple to set-up. However, one aspect that I do not like is that when all the steps have been completed, the final resulting “liquid” (DNA) is cloudy. In order for it to be used in the NanoDrop or for PCR, the liquid has to become clear, which, unluckily for me, can take up to hours or days. From the 14 bacteria I’m working with, only test tubes #4, #13 and #14 became clear in about 4 hours. Unfortunately, I was unable to work with bacteria #2 (it still has not grown on the TSA plate) and #12 (it was contaminated). Hopefully by next week, I will begin working with #2 and #12 to then move closer to finding the DNA of all the bacteria!
 |
| Figure 1. 14 bacteria in TSA broth at 0 hours |
 |
| Figure 2. 14 bacteria in TSA broth after 24 hours |
 |
| Figure 3. 12 1.7 mL test tubes filled with bacteria ready to centrifuge at 5000 RPM for 5 minutes. |
Thursday, August 31, 2017
Returning To S-STEM
I am grateful for having the opportunity to continue my S-STEM experience because it is a truly amazing place with wonderful people. During my first week, I had the chance to make my own TSA plates and also culture unknown bacteria. Most of the bacteria grew in 24 hours, others in 48 hours and about 2 showed no growth (currently growing at room temperature) (Figures 1-3). The purpose of this is to then be able to grow bacteria in a broth, perform a DNA extraction method and, eventually, be able to identify what kind of bacteria it is. All of this ties into this semester’s research project with WAESO, which I am very excited about! I will be working with isolated bacteria from leaves of a creosote bush (Larrea tridentata) and using genetic sequencing to identify the bacteria present. Fortunately, this will be a continuance of what I did last semester so I cannot wait to see what this research has in store!
 |
| Figure 1. TSA plates after the solution of TSA powder and distilled water was poured. |
 |
| Figure 2. 14 TSA plates with unknown bacteria (0 hours) |
 |
| Figure 3. 14 TSA plates with unknown bacteria after 24 hours |
Thursday, May 4, 2017
2017 Metro Tech Presentation
This week generally consisted about getting ready for finals and working on my research paper. However, I also had my second presentation at Metro Tech High School! It was quite different than the EMCC Student Conference in several ways. One is that at this presentation, judges were walking around while at EMCC, they were sat at a station. Plus, everyone at Metro Tech was from Phoenix College and at Estrella, students were from all around the district! Nonetheless, I definitely had a good time with my peers and enjoyed each and everyone’s company. Not to mention that everyone did such a great job! :)
References:
Metro Tech High School. (n.d.). Retrieved May 05, 2017, from http://www.phxhs.k12.az.us/metrotech
References:
Metro Tech High School. (n.d.). Retrieved May 05, 2017, from http://www.phxhs.k12.az.us/metrotech
 |
| Metro Tech High School's logo. ("Metro Tech High School", 2017) |
Thursday, April 27, 2017
2017 EMCC Student Conference
Similar to last week, this week consisted of working on my presentation and continuing to revise my poster. Not only that but I actually presented my poster (attached below)! I reminded myself that whatever happened, would happen. Either I would place in 1st, 2nd, or 3rd or I wouldn’t place in any at all. Quite frankly, I was okay with that because I was satisfied with what I had brought to the table. Plus, with the assurance of my mentors, Josh and Matt, and Arane, a friend of mine, I slowly started to gain confidence. In the end, I did not receive any award but Arane placed in 1st! :) I’m proud of myself for making it into the conference and coming this far. I know there is more waiting for me!
 |
| DNA Extraction from Enterococcus faecalis Using Four Different DNA Extraction Methods. |
 |
| Ready to begin presenting my research project at the 2017 EMCC Student Conference. |
 |
| Presenting my research project in front of the 3 judges at the 2017 EMCC Student Conference. |
Thursday, April 20, 2017
EMCC Student Conference Poster
I was fortunate enough to have been selected to present my research project at the 2017 EMCC Student Conference. Because of this, most of my week consisted of adding, editing and deleting items from my poster. Creating a poster may not seem like fun for others but in this case, I enjoyed making it. In high school, I took a graphic design class (which I loved) and even though this poster did not require much, it definitely reminded me of that class. It reminded me of the way colors work, the spacing between words and how small or big images should be. This was different than the usual “researching and following protocols” day. Now, that’s not to say I don’t like those days but I definitely liked the change in schedule. Below is a draft of the poster (I will upload the final once it has been revised/ approved). Nonetheless, presentations begin on April 26th and I am trying not to freak out!
 |
| 2017 EMCC Student Conference Poster Draft |
Thursday, April 13, 2017
Electrophoresis
This week, to determine the quantity of DNA yielded from each extraction method, (QuickExtract DNA extraction kit, boiling, microwave and enzymatic digestion followed by heating) agarose electrophoresis was performed. Through this, I became very confused with the results. Before I get into this, in the first slot, I had inserted a PCR MW Ruler. After that, the following slots from 2-13 were filled with 1 microliter of dye mixed with 5 microliters of DNA from QE1 (QuickExtract protocol), QE2, QE3, M2 (microwave protocol), M3-1, M3-2, M4, B3 (boiling protocol), EDL2 (enzymatic digestion followed by heating using Ready-Lyse Lysozyme), EDL3, EDL4, EDL5 and EDP1 (enzymatic digestion followed by heating using proteinase K) respectively. Using the NanoDrop spectrophotometer (Figures 1 and 2), it is shown that the enzymatic followed by digestion samples had relatively a higher amount of DNA (looking under the column “nucleic acid”). With that said, I was expecting that slots 10 and beyond (which had the enzymatic digestion followed by heating samples) would have bright strands of DNA. The brighter the strands, the more DNA would be present. However, to my surprise, that was not the case. Instead, the microwave method, which had less DNA than mentioned protocol, had brighter strands. As a matter of fact, slots 9-14 appear to have no strands at all (Figure 3). Next week, PCR will be performed on these samples to determine if I have any DNA. In the meantime, I am hoping that the PCR will not cause any further confusion.
 |
| Figure 1. NanoDrop Spectrophotometer nucleic acid report of all samples from different DNA extraction methods. |
 |
| Figure 2. NanoDrop Spectrophotometer nucleic acid report of all samples from different DNA extraction methods. |
 |
| Figur,e 3. Electrophoresis results after sampling PCR MW Ruler, QE1, QE2, QE3, M2, M3-1, M3-2, M4, B3, EDL2, EDL3, EDL4, EDL5 and EDP1 in each slot respectively. |
Thursday, April 6, 2017
Enzymatic Digestion Followed By Heating Protocol Modifications
After looking at the Nucleic Acid Report I collected from the NanoDrop Spectrophotometer last week, I noticed that the best DNA extraction method (compared to the others) so far is the enzymatic digestion followed by heating using Ready-Lyse Lysozyme and proteinase K (Figure 1). When referring to the “best DNA extraction method”, it is the protocol that has a purity close to 1.8 for DNA and close to 2.0 for RNA under the 260/280 column (“260/280 and 260/230 Ratios”, n.d.). Because the values for the enzymatic digestion followed by heating using Ready-Lyse Lysozyme and proteinase K are somewhat close to these values (closer than the other protocols, excluding the commercial kit), during this week, I worked specifically with these two protocols. However, the past week, in tubes EDL1, EDL2 and EDL3, I added 1 microliter of Ready-Lyse Lysozyme and in tubes EDP1, EDP2 and EDP3, I added 2 microliters of proteinase K. This week, in tubes EDL 4 and EDL 5, I added 2 microliters and 3 microliters of Ready-Lyse Lysozyme respectively. Using proteinase K, in tubes EDP 4 and EDP 5, I added 3 microliters and 4 microliters of proteinase K respectively. The results of the purity (260/280 column) of DNA in each tube are shown below in Figure 2. With these results, the increase in Ready-Lyse Lysozyme seems to decrease the purity of DNA and RNA and decrease the number of nucleic acid. However, an increase in proteinase K seems to have very little effect on the amount of nucleic acid and purity of DNA and RNA, increasing slightly in both areas.
Works Cited:
260/280 and 260/230 Ratios [PDF]. (n.d.). Wilmington: Thermo Scientific. |
| Figure 1. Eppendorf tubes EDL1, EDL2, EDL3, EDP1, EDP2 & EDP3 used in the enzymatic digestion followed by heating protocol using Ready-Lyse Lysozyme and proteinase K. |
 |
| Figure 2. Eppendorf tubes EDL4, EDL5, EDP4 & EDP5 used in the enzymatic digestion followed by heating protocol using proteinase K. |
Thursday, March 30, 2017
NanoDrop Spectrophotometer Nucleic Acid Report
During this week, I focused primarily on the enzymatic digestion followed by heating protocol. Specifically, since this protocol has three different ways to perform it (using Ready-Lyse Lysozyme, proteinase-K, 10% Tween 20 and 20% SDS), I did not use Ready-Lyse Lysozyme and worked with the remaining substances. I was able to perform three sets of Eppendorf test tubes that used proteinase-K and another three that used proteinase-K plus 10% Tween 20 and 20% SDS. After I was done with the protocols, I ran them under the NanoDrop Spectrophotometer and the results are shown below. Not only does the graph show the values for these six test tubes but it shows the results of all of the protocols I have performed so far (boiling, QuickExtract commercial kit and microwave).
 |
| NanoDrop Spectrophotometer nucleic acid report of the boiling protocol, QuickExtract commercial kit, microwave protocol and enzymatic digestion followed by heating protocol. |
Thursday, March 23, 2017
Enterococcus faecalis
Enterococcus faecalis is a gram-positive opportunistic pathogen that generally causes urinary tract infections, wound infections and a variety of nosocomial (originate in a hospital) infections. To better see this bacteria, the first image shown below shows a Scanning Electron Micrograph (SEM) of it. Through fecal contamination, this bacteria is commonly found in food, sewage, water and soil (Paulsen, 2003). In other words, it can be found in a variety of materials we come into contact everyday. In addition, E. faecalis is able to withstand “oxidative stress, desiccation, and extremes of temperature and pH, and it has high endogenous resistance to salinity, bile acids, detergents, and antimicrobials” (Paulsen, 2003). Because of this, it has acquired “intrinsic resistance to many antibiotics and a remarkable capacity for developing resistance to others” and “now ranks among the most troublesome hospital pathogens” (Phillips, 1995). For example, E. faecalis has become resistant to vancomycin. The bacteria's genome carries its ability for resistance, which is shown below in the second image. As a result of its resistance, this bacteria “persist[s] in the hospital environment and survive[s] many host defenses” (McBride, 2007). Not only has it become resistant to various antibiotics and antimicrobial agents but it produces a two-subunit toxin, also known as cytolysin; this toxin is active against eukaryotic and prokaryotic cells. With the production of cytolysin, this bacteria is able “to actively probe the environment for target cells, and when target cells are detected, allows the organism to express high levels of cytolysin in response” (Coburn, 2004). However, this toxin is not the only material produced by E. faecalis, it also creates a “gelatinase, enterococcal surface protein Esp, aggregation substance, a hyaluronidase, and a bile salt hydrolase”, which are “known or suspected of enhancing the virulence” of this bacteria. (McBride, 2007).
Unfortunately, due to how complex this bacteria is, knowledge as to how it causes diseases and “transfer[s] antibiotic resistance to other pathogens” is limited (Nallapareddy, 2005). Therefore, because of its complexity, expanding knowledge on Enterococcus faecalis is evidently necessary and critical. In other words, being able to “characterize the genetic background of a [E. faecalis] strain makes possible the study of the flow of mobile elements within the species” (McBride, 2007). Being able to successfully accomplish this will “define the diversity of the E. faecalis species and to determine the core genome content” (McBride, 2007). With this, pharmaceutical scientists will be able to develop or improve drugs currently used on this bacteria and, thus, allow affected individuals to recover quickly and more efficiently.
Through DNA extractions of Enterococcus faecalis, identifying it, diagnosing infections and progressing in drugs will easily be achieved. Hence, in an attempt to quickly, successfully and effectively identify E. faecalis, four different DNA extraction protocols will be performed. These methods will determine which one is successful in yielding the most amount of DNA. The DNA extraction protocols are as follows: QuickExtract Bacterial DNA Extraction Kit, boiling method, microwave method and enzymatic digestion followed by heating method. These four procedures will be compared to a commercially produced kit. It is hypothesized that the boiling method will yield the most amount of DNA in Enterococcus faecalis. Following the boiling method, it is expected that the procedure to produce the second highest amount of DNA in E. faecalis will be the enzymatic digestion followed by heating. Lastly, the microwave method is expected to yield the least amount of DNA of this bacteria. In order to determine the quantity of DNA yielded from each extraction protocol, nanodrop spectrophotometry and electrophoresis will be performed.
Sources
Ahmed, O., Asghar, A., & Elhassan, M. (2014). African Journal of Microbiology Research. Comparison of three DNA extraction methods for polymerase chain reaction (PCR) analysis of bacterial genomic DNA. Retrieved February 23, 2017, from http://www.academicjournals.org/article/article1391446214_Ahmed%20et%20al.pdf
Coburn, P. S. (2004). Biography in Context. Enterococcus faecalis senses target cells and in response expresses cytolysin, 306. Retrieved March 23, 2017.
Dashti, A., Jadaon, M., Abdulsamad, A., & Dashti, H. (2009). Heat Treatment of Bacteria: A Simple Method of DNA Extraction for Molecular Techniques. Kuwait Medical Journal. Retrieved from https://www.researchgate.net/publication/266888615_Heat_Treatment_of_Bacteria_A_Simple_Method_of_DNA_Extraction_for_Molecular_Techniques
Englen, M., & Kelley, L. (2000). Letters in Applied Microbiology . A rapid DNA isolation procedure for the identification of Campylobacter jejuni by the polymerase chain reaction. Retrieved February 23, 2017, from http://onlinelibrary.wiley.com/store/10.1046/j.1365-2672.2000.00841.x/asset/j.1365-2672.2000.00841.x.pdf?v=1&t=izj0lngs&s=ffc6e6e746158600322301279b959afb27079119
Epicentre. (2012). QuickExtract™ Bacterial DNA Extraction Kit. Retrieved February 28, 2017, from http://www.epibio.com/docs/default-source/protocols/quickextract-bacterial-dna-extraction-kit.pdf?sfvrsn=8
McBride, S., Fischetti, V., LeBlanc, D., Moellering, R., & Gilmore, M. (2007). PLOS One. Genetic Diversity among Enterococcus faecalis. doi:10.1371/journal.pone.0000582
Nallapareddy, S., Wenxiang, H., Weinstock, G. M., & Murray, B. E. (2005). Journal of Bacteriology. Molecular Characterization of a Widespread, Pathogenic, and Antibiotic Resistance-Receptive Enterococcus faecalis Lineage and Dissemination of Its Putative Pathogenicity Island. Retrieved March 23, 2017.
Oliveira, C. F., Paim, T. G., Reiter, K. C., Rieger, A., & D'azevedo, P. A. (2014, Jan. & feb.). Evaluation of four different DNA extraction methods in coagulase-negative staphylococci clinical isolates. Retrieved February 23, 2017, from https://www.ncbi.nlm.nih.gov/pmc/articles/PMC4085835/
Paulsen, T., Banerjei, L., & Myers, G. S. (2003). Science. Role of Mobile DNA in the Evolution of Vancomycin-Resistant Enterococcus faecalis. doi:10.1126/science.1080613
Phillips, D. M., Ph.D. (1995). Images in Clinical Medicine (K. Eagle M.D., Ed.). Enterococcus faecalis. doi:10.1056/NEJM199501053320105
 |
| Scanning Electron Micrograph (SEM) of Enterococcus faecalis. (Phillips, 1995). |
 |
| Enterococcus faecalis genome (Paulsen, 2003). |
Subscribe to:
Posts (Atom)